Get started with Prometheus on Grafana Cloud

Offered as a fully managed service, Grafana Cloud Metrics is a super fast massively and highly available Prometheus compatible backend. Import your historical data and unify all your metrics seamlessly within Grafana Cloud.

Sign up and get free forever access to:
  • 10k series for Prometheus metrics
  • 50GB of logs
  • 50GB of traces
  • 14-day retention for metrics and logs
  • Access for up to 3 team members
  • Plus a 14-day trial of Grafana Cloud Pro to explore unlimited metrics, logs, users, and premium features.

Get Grafana OnCall fully-managed with Grafana Cloud

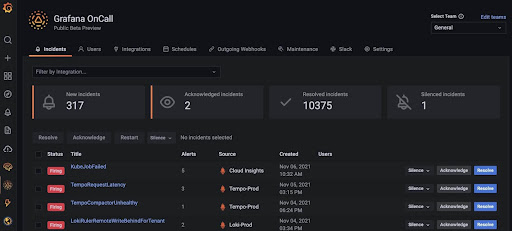
Grafana OnCall is an easy-to-use on-call management tool intuitively built into Grafana Cloud that will help reduce toil in on-call management through simpler workflows and interfaces that is tailored specifically for engineers.

Free forever access to: 

  • 100 SMS / Voice Notifications
  • 10k series for Prometheus metrics
  • 50 GB of logs and 50 GB of traces
  • 14-day retention
  • Access for up to 30 users
  • Plus a 14-day trial of Grafana Cloud Pro to explore unlimited SMS/Voice, metrics, logs, users, and premium features.

Blazing fast PromQL queries with massive cardinality

Included in your Grafana Cloud stack is a massively scalable, high-performance, and highly available Prometheus instance. Bring together the raw, unsampled metrics for all your applications and infrastructure, spread around the globe, in one place. Query high cardinality data with blazing fast PromQL and Graphite queries. Centralize the analysis, visualization, and alerting on all of your metrics. 
  • Multi-tenant, highly scalable Prometheus metrics storage
  • Custom long-term retention at 13 months
  • Single query endpoint centralizing all individual Prometheus instances

Simple alert configuration in Grafana Cloud

With Grafana Cloud alerting, a simple UI embedded right in your Grafana instance can be used to manage alerts — allowing your alerting to become self-service. Create, manage, and silence all of your alerts within one simple Grafana Cloud alerting page. All these options are also available via a RESTful API with tooling to enable a GitOps-style workflow.

Grafana Cloud also allows Prometheus-style alerting on the contents of the logs. A unified experience allows you to manage alerting rules for both metrics and logs directly in Grafana. This is especially useful for third-party systems that don’t export metrics.

A powerful and flexible query language

Grafana Logs uses a similar label format and query language to Prometheus, making it easier to learn and faster to switch between metrics and logs when diagnosing an issue.

  • Query logs with the same syntax used for querying metrics
  • Write log queries that allow you to dynamically filter and transform your log lines
  • Easily calculate metrics from your logs, like the rate of errors or top K sources with the highest log volume
  • Minimal indexing at ingest time means you can slice and dice your logs dynamically at query time to answer new questions as they arise

Data sources

Azure
Google Sheets
InfluxDB
PostgreSQL
Datadog
GitHub
Percona
Zabbix
Turtle
Clock
Graphite
Kubernetes
Instana
D3
MySQL

Implementation details and best practices

dsafadsfds

Grafana Cloud

Get centralized view into your observability, wherever it lives

Grafana Grafana

Create, explore, and share beautiful dashboards that combine data from multiple sources to foster a data-driven culture within your team.

Logs Logs

Experience the magic of switching from metrics to logs with preserved label filters and time ranges. Quickly search through all your logs or stream them live.

Metrics Metrics

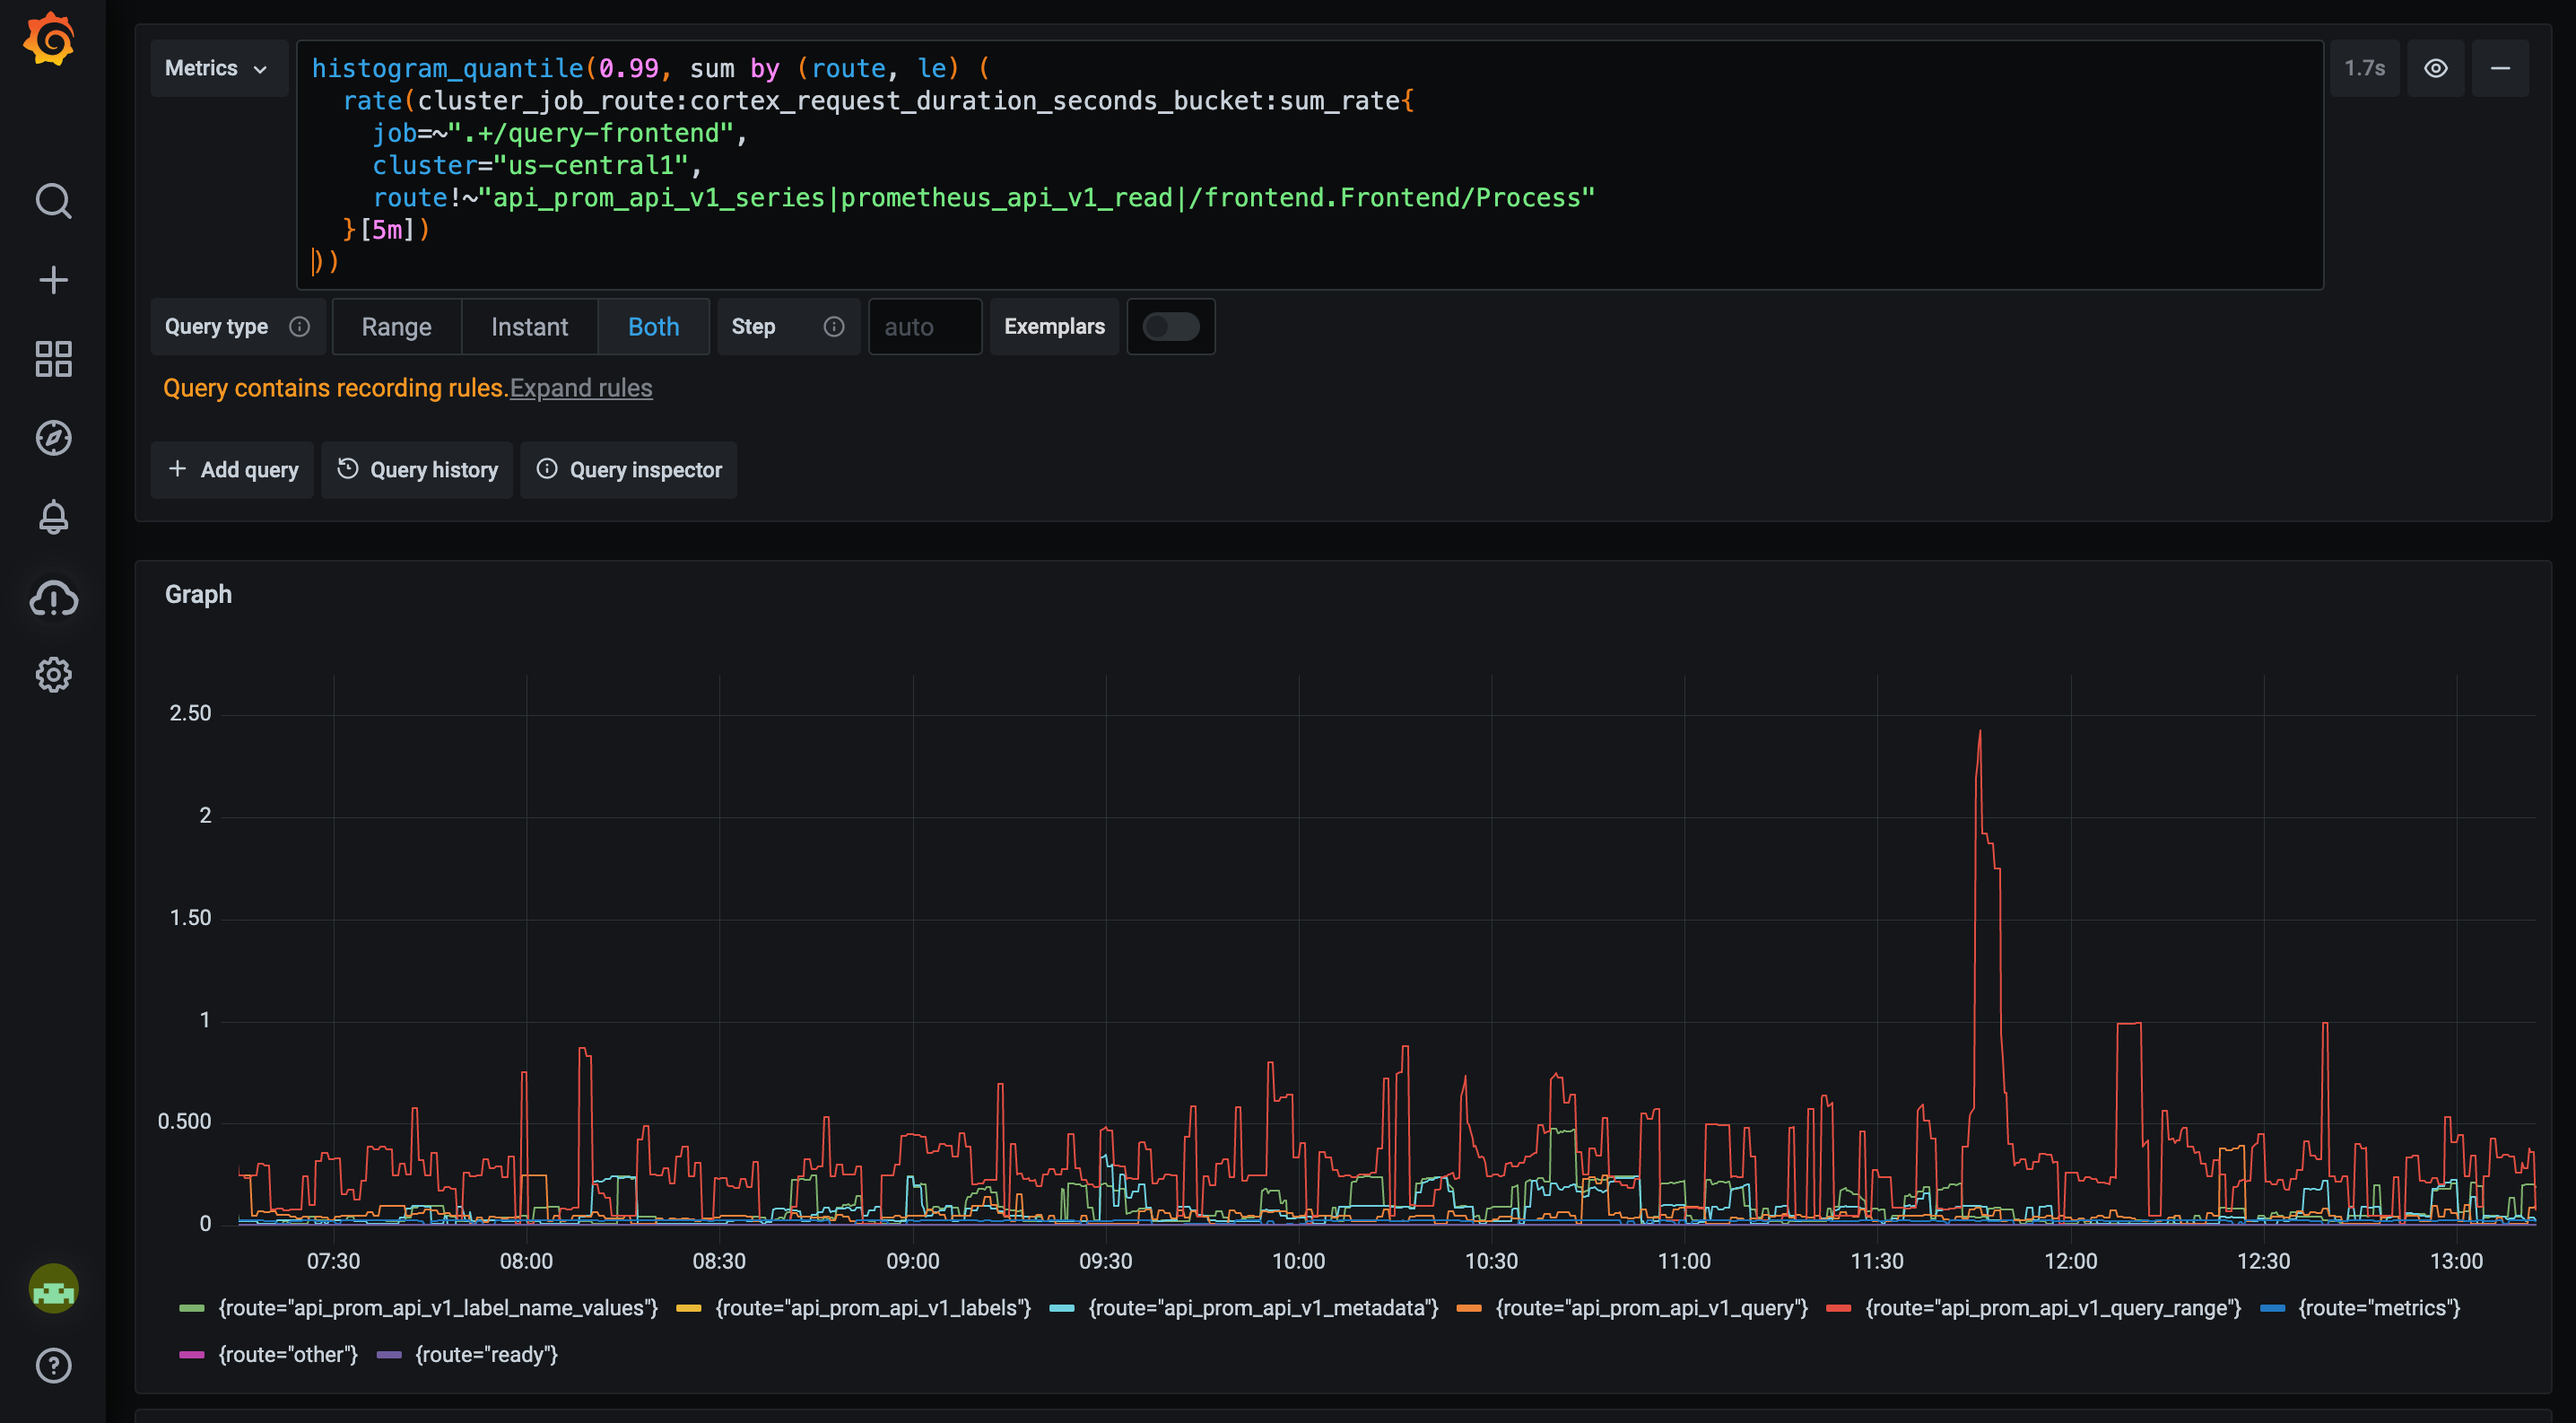
Explore your data through ad-hoc queries and dynamic drilldown. Split view and compare different time ranges, queries, and data sources side by side.

Traces Traces

Grafana ships with built-in support for Grafana Tempo, a high-volume, minimal-dependency open source tracing solution.

Out-of-the-box dashboards and alerting for your services


Azure
Google Sheets
InfluxDB
PostgreSQL
Datadog
GitHub
Percona
Zabbix
Turtle
Clock
Graphite
Kubernetes
Instana
D3
MySQL

Thousands love Grafana

Salesforce
PayPal
eBay
Pernod Ricard
Verizon
Grofers
Dapper
HEB
Roblox
Siemens

Related content

Get started with Prometheus in minutes