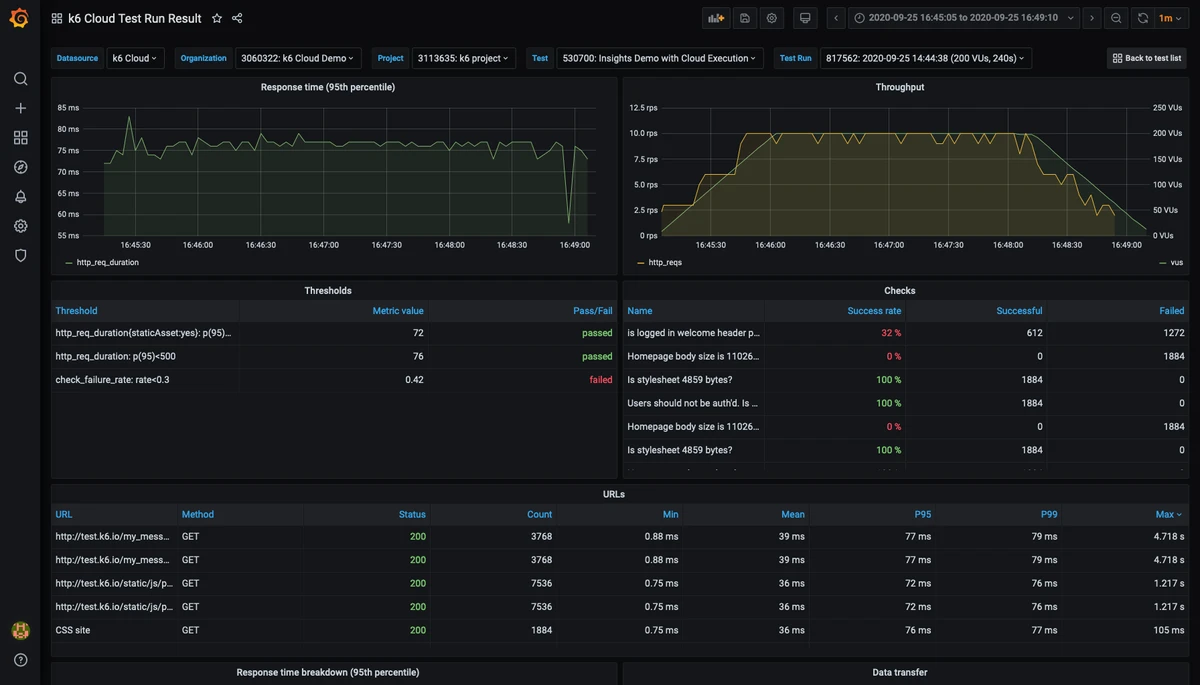
Get started with k6 metrics in Grafana Cloud
Send your k6 metrics into Grafana Cloud to better visualize your testing results, enabling you to correlate k6 metrics with other metrics of your monitored services using Grafana.
Your new account includes free forever access to:
- 10k series for Prometheus metrics
- 50GB of logs
- 50GB of traces
- 14-day retention for metrics and logs
- Access for up to 3 team members
- Plus a 14-day trial of Grafana Cloud Pro to explore unlimited metrics, logs, users, and premium features
Full stack metrics and logging in minutes

From zero to observability in minutes
Building an integrated observability stack from open source components takes time. With Grafana Cloud you can go from zero to beautiful graphs, insightful logs, and valuable alerts in minutes. Select the service(s) to monitor, install the Prometheus-inspired agent, and get preconfigured alerts and dashboards.
Action items for a successful transition
- Sign up for a free Grafana Cloud account.
- Follow the instructions in this tutorial to learn how to install and start running checks.
- If you need help understanding how features and setup compare between worldPing and Grafana Cloud, read this blog post.
Data Sources
Made for you, managed by us
Operate at scale
Grafana Cloud is built with modern distributed systems techniques to grow with your applications and infrastructure. No artificial limits or barriers, just true horizontal scalability.
- Easily scale past 100M+ metrics
- 13-month metrics retention for trend analysis and capacity planning
- 30 days of log retention

Reduce operational overhead
Let our team manage and maintain the service so you always have:
- Automatic upgrades that alleviate the need for maintenance
- Guaranteed availability with 24x7 on-call support
- Capacity to scale with your growth
Get a centralized view into your observability, wherever it lives.
Logs
Tightly integrated log aggregation and storage with Loki
Grafana
Dedicated Grafana instance with unlimited dashboards
Traces
Easy-to-operate, highly scalable, and cost-effective distributed tracing system with Grafana Tempo
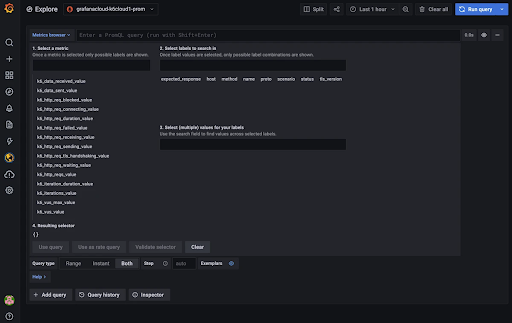
Metrics
Super fast Prometheus- and Grapite-compatible backend
Out-of-the-box dashboards and alerting for your services
Thousands love Grafana
