Get started in minutes with Grafana Cloud

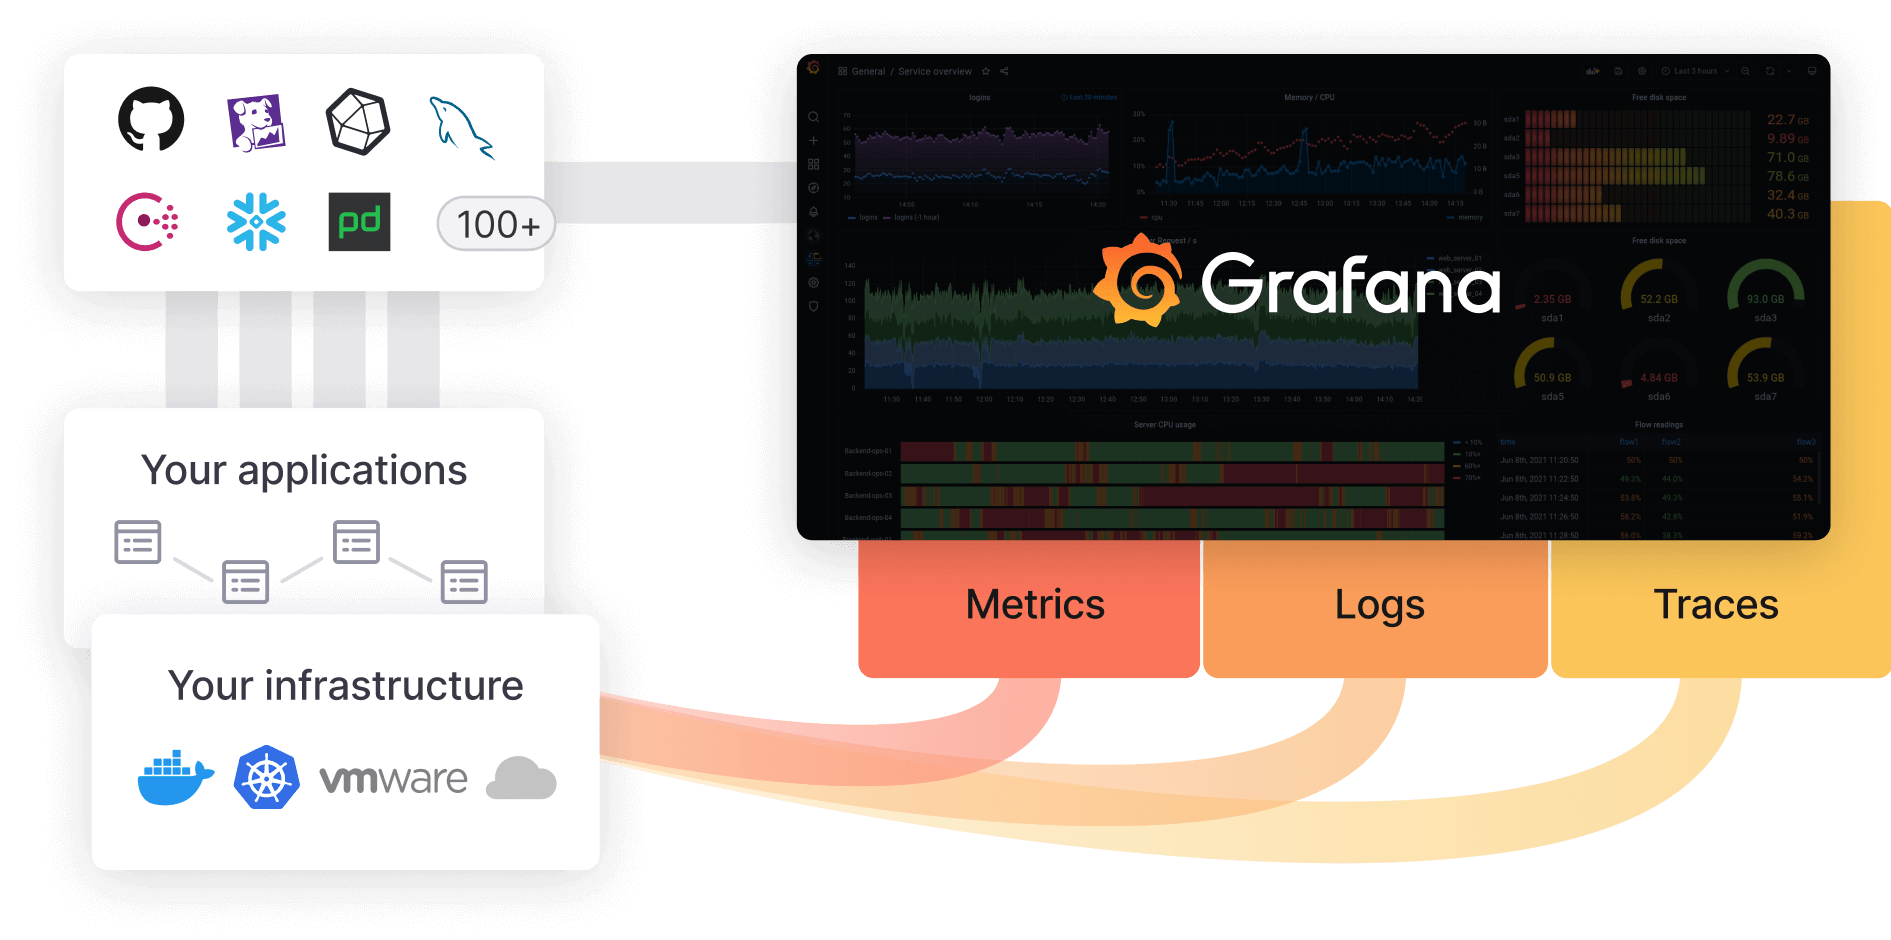
Grafana Cloud is a fully managed observability platform for your applications and infrastructure. Leverage the best open source observability software – including Prometheus, Loki, and Tempo – without the overhead of installing, maintaining, and scaling your observability stack.

Sign up and get free forever access to:

  • 10k series for Prometheus metrics
  • 50GB of logs
  • 50GB of traces
  • 500 VUh k6 testing
  • 14-day retention for metrics and logs
  • Access for up to 3 team members
  • Plus a 14-day trial of Grafana Cloud Pro to explore unlimited metrics, logs, users, and premium features.

Get Grafana OnCall fully-managed with Grafana Cloud

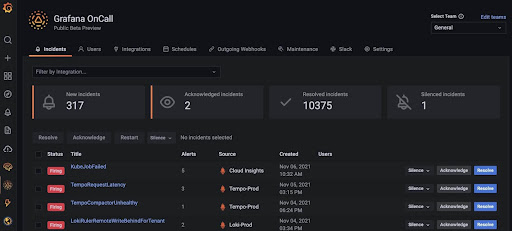
Grafana OnCall is an easy-to-use on-call management tool intuitively built into Grafana Cloud that will help reduce toil in on-call management through simpler workflows and interfaces that is tailored specifically for engineers.

Free forever access to: 

  • 100 SMS / Voice Notifications
  • 10k series for Prometheus metrics
  • 50 GB of logs and 50 GB of traces
  • 14-day retention
  • Access for up to 30 users
  • Plus a 14-day trial of Grafana Cloud Pro to explore unlimited SMS/Voice, metrics, logs, users, and premium features.

From zero to observability in minutes

Building an integrated observability stack from open source components takes time. With Grafana Cloud you can go from zero to beautiful graphs, insightful logs, and valuable alerts in minutes. Select the service(s) to monitor, install the Prometheus-inspired agent, and get preconfigured alerts and dashboards.

Multiple ways to collect, store, visualize, and alert on data with Grafana Cloud

  • Full stack metrics and logging in minutes: With integrations, you can get a preconfigured Prometheus and Grafana-based observability stack up and running in minutes.
  • Bring your own data (BYOD): Endpoints for Prometheus, Graphite, and Loki let you ship data from multiple sources to Grafana Cloud, where you can then build dashboards that aggregate, query, and alert on data across all of these sources.
  • Unify your data: Using Grafana Cloud’s fully-managed, dedicated Grafana service, you can visualize observability metrics from existing data sources running in your environment and managed data endpoints built-in to Grafana Cloud.

Centralized view of incidents

Grafana OnCall provides a central view of all your incidents, right within Grafana Cloud and the Grafana UI you know well. This allows you to quickly see and update the status of incidents and search for older resolved incidents.

Data sources

Azure
Google Sheets
InfluxDB
PostgreSQL
Datadog
GitHub
Percona
Zabbix
Turtle
Clock
Graphite
Kubernetes
Instana
D3
MySQL

Implementation details and best practices

dsafadsfds

Grafana Cloud

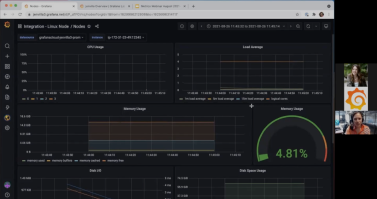
Get centralized view into your observability, wherever it lives

Grafana Grafana

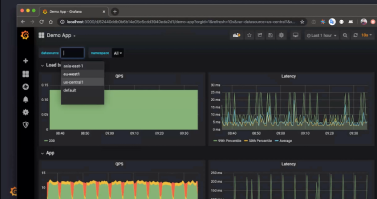
Create, explore, and share beautiful dashboards that combine data from multiple sources to foster a data-driven culture within your team.

Logs Logs

Experience the magic of switching from metrics to logs with preserved label filters and time ranges. Quickly search through all your logs or stream them live.

Metrics Metrics

Explore your data through ad-hoc queries and dynamic drilldown. Split view and compare different time ranges, queries, and data sources side by side.

Traces Traces

Grafana ships with built-in support for Grafana Tempo, a high-volume, minimal-dependency open source tracing solution.

Out-of-the-box dashboards and alerting for your services


Azure
Google Sheets
InfluxDB
PostgreSQL
Datadog
GitHub
Percona
Zabbix
Turtle
Clock
Graphite
Kubernetes
Instana
D3
MySQL

Thousands love Grafana

Salesforce
PayPal
eBay
Pernod Ricard
Verizon
Grofers
Dapper
HEB
Roblox
Siemens

Related content

Get started with Grafana Cloud in minutes